When is faith in a backup supplier strategy misplaced?

Will your backup supplier be there when you need them?

Multi-sourcing is a common risk mitigation strategy, but just because you have a relationship with a second supplier doesn’t guarantee supply in the event of a disruption.  In my experience, people put a lot of confidence in the fact that they have a backup supplier. A sort of, “oh we have a backup supplier so we’ll be fine”, attitude prevails.  However, as discussed below, this confidence may be misplaced.  This is not to say that having multiple suppliers is not a valid risk management strategy – it absolutely reduces risk in the case of a primary supplier failure.  But there are also scenarios where additional suppliers are unlikely to be of any value, and it’s important to be aware of (and appropriately mitigate) these risks.

In August of 1997, members of the International Brotherhood of Teamsters struck United Parcel Service (UPS) for fifteen days.  At that time there were three providers of overnight parcel service: UPS, Federal Express, and Airborne (since absorbed by DHL).  In response to the strike at UPS, FedEx chose to protect service levels in their network and limited customers to a 10% increase over their historical shipment volume.  Consequently, even those customers that had a dual sourcing arrangement in place were impacted to the extent they had volume with UPS.  The simple fact was that there was not enough excess capacity in the overnight parcel network to absorb a disruption of either of the major players.

The 1997 UPS Strike

A more recent example is the 2016 Hanjin bankruptcy.  When Hanjin failed, their customers were clearly the most severely impacted.  However, all container shippers were ultimately impacted as the failure of Hanjin left the industry as a whole short on capacity resulting in delayed shipments and price hikes.  Price increases were a long lasting impact as they were needed to restore the balance between capacity and demand.

The 2016 Hanjin Bankruptcy
Key Lesson #1: Capacity matters

These brief case studies offer some important lessons to supply chain practitioners:

Key Lesson #1: A backup supplier is only an effective strategy to the extent that the backup supplier or suppliers have capacity to absorb the required increase in volume.  This is a basic truth, but in my experience, it is often overlooked in practice.

Corollary: The more concentrated the supply base, the more likely a disruption will spread

Corollary #1A: When industry capacity is concentrated in a few suppliers, the disruption of any one of those suppliers can result in negative impacts for all customers of that industry – not just the customers of the disrupted supplier. 

In the case of the UPS strike, FedEx protected its customers and its brand from service impacts by capping shipments.  However, when Hanjin failed, there were no such protections as former Hanjin customers overwhelmed the remaining capacity.  All ocean shippers experienced disruptions, not just those that had used Hanjin. The imbalance between capacity and demand created by the loss of a major supplier led to shipment delays and price increases across the industry.

Key Lesson #2: When a supply market is disrupted, the effectiveness of a mitigation strategy depends on the actions of other customers and suppliers in the market space. 

When developing strategies to mitigate potential supply chain disruptions, it’s best to approach the problem with a little bit of Game Theory.  In other words, consider how other customers of the disrupted supplier will respond.  What strategies are they likely to put in place?  How will potential backup suppliers respond to the disruption of a competitor?  Does this information suggest a different approach? In the case of the UPS strike, if your company was the only one to implement a backup arrangement with FedEx, that strategy would have worked brilliantly.  The problem was that every other company had the same idea.  Knowing in advance how FedEx might respond (i.e., by capping shipment volumes) would have provided another indication that this strategy was not likely to be effective.

Key Lesson #2: Consider how others will react
Conclusion

So, can a backup supplier be an effective strategy?  Yes, in situations where the supplier’s industry is highly fragmented such that the loss of any one player does not disrupt the overall balance between capacity and demand.  And yes, when the risk that you are looking to mitigate is narrowly defined (e.g., quality issues for a product produced only for your firm) so as not to trigger a simultaneous response by other firms.  The use of a backup supplier can also be effective in combination with other strategies provided that the capacity limitations of the backup are well understood.  However, if the potential backup does not have the capacity to absorb the additional volume associated with the potential event or disruption – based on the expected actions of all parties affected by the disruption – then other strategies need to be considered.

A Demand Disruption is an event that causes a sudden and significant change in customer demand patterns that exceeds the ability of the supply chain to respond.

Have You Experienced a Demand Disruption?

Many companies have mature programs in place to manage the risk of supply disruptions, but are you prepared for a significant change in demand?

In preparation for a 2017 talk, I did a survey of the risks identified by products and services companies in the 1A Risks statements in their SEC 10-K filings.  Supply disruptions, while not the most frequently mentioned risk, were the only risk mentioned by every company in the survey.  It’s safe to say that supply disruptions are a constant concern for Boards, CEO’s, and Supply Chain leadership teams.  But what about a disruption to demand?  Particularly one that causes a sudden and significant increase in demand?  Recent experience during the COVID-19 pandemic has indicated that few companies have thought about, or are ready for such a disruption.

A supply disruption is an event that constrains the ability of a company to produce or deliver product to customers.  A shortage of a key raw material, downtime on a critical production resource, and severe weather that impacts transportation are all potential sources of a supply disruption.  But what then is a demand disruption?  A demand disruption is an event that causes a sudden and significant change in customer demand patterns that exceeds the ability of the supply chain to respond.  While both increases and decreases in demand can be considered to be disruptive, I will focus this discussion on increases.

A sudden increase in demand?  Most companies would say that’s a good problem to have.  However, when the increase is large enough to be disruptive, it comes with a host of problems.  To begin with, one company’s demand disruption is almost certainly a supply disruption for that company’s customers.  If demand increases to the point where it exceeds the capacity of the supply chain, then some portion of demand will not be met, or not met in a timely fashion.  Customers will see this as a disruption to their supply and respond accordingly.  A demand disruption then has the potential to drive increased costs through premium transportation, overtime, and potential contractual penalties.  Not to mention the impact on customer relationships.

What distinguishes a demand disruption from a supply disruption is the source.  In a demand disruption, the supply chain is operating normally, and at normal levels of demand there would be no issue.  To be a demand disruption, the primary cause of the disruption must be a change in the underlying demand patterns absent of any disruption to the impacted company’s supply.  The COVID pandemic has created a number of demand disruptions, both directly and indirectly.  It doesn’t take a global pandemic to create a demand disruption, but these are illustrative of how disruptions occur.

How can an increase in demand be a problem?

The toilet paper shortages experienced during the pandemic were due to a sudden change in the mix of consumer demand and not to any supply issue

How Could We Run Out of Toilet Paper?

Everyone is familiar with the toilet paper shortages that occurred during the pandemic, but few people really understand what caused them.  In simple terms, there are two kinds of toilet paper: Consumer, or what you buy for home use, and Commercial, or what you find in public and office restrooms.  When large numbers of people began to work from home during the pandemic, it created a significant shift in the mix of toilet paper consumption, with volume shifting from commercial to consumer grade. Overlaid on top of this was a spurt of panic buying (no one wants to run out of toilet paper!).  While the panic buying was transitory, the change in product mix could be expected to last as long as people continued to work from home – and in proportion to the number of people working from home.  This became an issue because different production assets are used to produce consumer vs. commercial grades and they are packaged differently.  So while there was excess supply of commercial toilet paper, production of consumer toilet paper could no longer keep up with demand.  The resulting supply shortages then were not the result of any supply side disruption – paper mills were producing as much as they could – but due to the sudden and sharp increase in demand for the consumer product.

The Backup Supplier Fallacy

When I ask people about their strategies for maintaining supply continuity, often the first one mentioned is having a backup supplier.  This is of course a valid strategy, but only in the right circumstances. When a supplier fails, the customers of that supplier will move to alternative suppliers.  In a highly fragmented supply base this is barely noticed.  However, as the supply base becomes more concentrated the ripples created by the failure of any one supplier grow larger and larger.  An example is the 2016 bankruptcy of Hanjin, the Korean container shipping line.  Given Hanjin’s size and market share in a concentrated supply market, Hanjin’s failure disrupted demand for all of the remaining lines as shippers sought container bookings from other lines.  Having a contract with another shipping line was of little value as every carrier had more demand than they had the capacity to support.  The result was delays of several weeks added to container transit times, and steep prices increases.  Ultimately, higher prices and time allowed the industry to reach a new equilibrium that once again balanced supply and demand.  The key learning here is that a backup supplier is only effective to the extent that they have the capacity to absorb the incremental demand created by a disruption elsewhere.

Bankruptcies, strikes, and other factors that eliminate a supply source, even temporarily, can cause a demand disruption for alternative sources.  This happened many times in the early stages of the COVID-19 pandemic as factories were idled.  To the extent that alternative sources were available and still operating, those companies experienced demand disruptions.

The disruption of one supplier in a market may create a demand disruption for the remaining suppliers as customers seek alternate sources
Large swings in demand can create demand disruptions, particularly at supply chain nodes operating close to capacity

The Chip Bullwhip

In their 1997 article, The Bullwhip Effect in Supply Chains[1], Lee et al described how variability can increase as demand propagates upstream in a supply chain.  This can create significant inefficiencies, but what happens when the effect is to increase demand beyond the capacity of the supply base?  Demand variability of significant magnitude can lead to demand disruptions.  This is particularly true when the supply base is highly capital intensive as the required capital investment acts as a disincentive to having excess capacity available to buffer surges in demand.

There is perhaps no better example of this than the current semiconductor chip shortage.  Semiconductor fabs are extremely capital intensive, costing billions to build.  This has led both to a high level of concentration in the supply base (five major players) and to production economics that incent running at capacity 24×7.  As an added complication, much of the output of these companies is unique customer devices produced on a make-to-order basis.  Producing to stock on these devices is high risk if it’s an option at all. When COVID related shutdowns began in March, 2020, customers cut their forecasts and orders for semiconductors.  Semiconductor output dropped, and in many cases capacity went unused.  But homebound consumers continued to buy, and at increased levels.  With extra money in their pockets from not traveling and not eating out, and new needs like laptops to allow their children to attend school virtually, consumer spending on technology surged.  By summer, semiconductor companies were seeing demand at pre-pandemic levels, and by fall of 2020 demand began to exceed the capacity available to support it.  Now, had demand remained constant throughout the year there would likely have been no issue, at least in 2020.  But the bullwhip which first pulled demand down and then up led to lost output and thus a loss of effective capacity.  Perhaps the industry most impacted by the chip shortage is the auto industry.  Unlike consumer electronics, many auto plants were closed for extended periods of time and forecasts and orders for semiconductors followed suit.  By the time that automotive plants began to reopen and place new orders, the available capacity in semiconductor fabs was fully utilized in support of other industries.  This only added to the demand disruption that was already in full swing.  As the last industry to restore demand, the auto industry has been bearing the brunt of chip shortages.

Now, interestingly enough, companies that supply raw materials to the semiconductor industry have seen a smaller magnitude of change in their demand.  This is because the capacity constraints of their customers act as a damper on the bullwhip.  As a general rule, while variability increases further upstream in the supply chain, capacity constraints often have a dampening effect on that variability.

[1] Lee, Hau L, Padmanabhan, V, and Whang, Seungjin; The Bullwhip Effect in Supply Chains; MIT Sloan Management Review, Spring 1997

Managing a Demand Disruption

While many see a sudden increase in demand as a good problem to have, it is a problem nonetheless.  How a company interprets and responds to a change in demand can have a significant impact on operating costs and customer good will.  It also creates a significant risk of trapping cash in unneeded inventory or capital equipment.  To successfully navigate a demand disruption, companies should focus on three areas: understanding the demand, managing customer relationships, and maximizing output.

Understand the demand, manage customer relationships, maximize output
Understanding why the demand disruption began is key to being able to forecast how it will end

Why?

The first step in navigating a demand disruption is to understand what happened and how events are shaping demand. Understanding begins with asking a lot of, “why”, questions to get to the root cause of the change.  Once you know what happened and how customers responses to events are shaping demand, you can move on to the other critical questions.  The first of these is, “Is the change temporary, or does it single a transition to a new equilibrium?”  In the case of pandemic demand for toilet paper, the change in demand was caused by people working from home instead of in an office environment.  At some point, people will return to the office, although some portion of the population may transition to some level of working from home permanently.  The return to the office is not likely to happen overnight, and forecasts of future demand should reflect a gradual transition back to something like the historical mix.  In the Hanjin bankruptcy example cited earlier, the change is permanent. But it should be expected that the market will gradually return to a new equilibrium as the remaining competitors add capacity until supply approximates demand.  The duration of the change is a key consideration in determining how to properly respond.  A short term change likely does not justify significant capacity investments to increase output as the incremental capacity will quickly be idled.  However, a permanent change with an opportunity to capture long term market share gains may justify investment.

Disruptions are often magnified by shortage gaming behavior.  Remove this extra demand prior to formulating a response  

When customers are faced with a shortage of supply, they may attempt to game the system by inflating orders and forecasts in the hopes that this will give them a larger allocation.  This behavior can significantly distort the demand signal, leading to incorrect decisions about production plans or capacity investments.  The second part of understanding demand is to relentlessly scrub customer orders and demand forecasts to understand what is the real demand signal and what is fluff.  This is best approached from a variety of angles, such as looking at historical demand, market size and market share, and other indicators to develop a consensus on a reasonable estimate of demand. In this exercise it is often useful to identify upper and lower bounds as opposed to a single number.  When supply ultimately begins to catch up to demand, the additional demand created by gaming will quickly evaporate, potentially leaving piles of inventory or idle production lines in its wake if not handled properly.

Managing Customer Relationships

During a demand disruption demand exceeds available supply.  Customers will experience this as a supply disruption that negatively impacts their business.  Managing customer relationships during this time is key.  From a supply chain perspective, the key customer relations question is who gets what when.  In other words, allocation. Companies should implement an allocation process well in advance of any disruption to demand.  This may be an extension of the process used during routine backorders, but modifications are needed to address the scope, scale, and likely duration of a demand disruption.  Having the process in place allows for an agile response that can begin when the potential for disruption first appears on the horizon.

A good allocation process involves Supply Chain working closely with the Commercial team to understand the available tradeoffs and implications on both operations and customers.  The process should allow for evaluation of various allocation schemes and priorities and must be able to address customer shortage gaming behaviors. Key considerations are maintenance of current customer relationships and commitments vs. opportunities to grow volume and market share.  Finally, the process must consider the inevitable escalations from customers to senior executives and how these requests will be resolved.

A good allocation process and strategy is key to managing customer relationships
Consider non-traditional ways to get additional output to close the demand-supply gap

Maximize Volume

When demand exceeds supply, the natural response is to try to increase supply.  In the long term, it’s possible (but not necessarily prudent) to add capacity to restore the supply-demand balance.  In the short term however it’s critical to consider all avenues to increase output with existing capacity. This can happen through adding shifts or increasing overtime, but it’s important to also consider more radical approaches. During the pandemic, certain food producers increased output by temporarily slashing their SKU portfolio and focusing on the highest volume products only – for example, stopping the production of ziti noodles to produce more spaghetti.  The specific tradeoffs available will vary widely by company and production technology, but radical moves such as this must be considered in the face of a significant demand disruption

Conclusion

Prior to the pandemic, the concept of a demand disruption was largely outside of the vocabulary of many supply chain professionals.  However, the pandemic has brought this into sharp focus with most of us feeling the impact of demand disruptions in toilet paper, pasta, and other grocery staples.  But you don’t need a global pandemic to create a demand disruption.  Bankruptcies, natural disasters, and the

Demand disruption is a risk that existed before, and will exist after the pandemic

Avoiding Common Mistakes

While there is general agreement that reducing inventory levels is beneficial, there does not seem to be consensus on how to value a reduction in inventory.  Whether it’s from my university students or corporate managers and executives, I frequently see business cases associated with inventory reduction projects that grossly misrepresent the benefits associated with that reduction. At best these undervalue the benefits, but in many cases the errors would cause an incorrect decision about the initiative or investment in question.  Every situation is different, but I would like to lay out what I believe is the correct approach and framework for building an inventory reduction business case – one that puts the right variables in focus to drive good decisions.

I believe that the primary reason that many people and companies struggle with business cases around inventory is that, fundamentally, inventory is about cash flow where most supply chain business cases are about cost reduction.  This leads to the first of the common mistakes that I see:

Common Mistake #1: Focusing the business case on costs and ignoring cash impacts

The desire to focus on costs is very natural, after all it’s what we do in most other supply chain business cases.  And almost any action that impacts inventory will also impact cost elements, like warehousing and obsolescence, in addition to implementation costs.  This often creates a desire to convert the change in inventory to a set of cost impacts – with cost of money being one – and ignore the direct cash flow impacts. This is particularly true when there is a desire to hit a cost reduction target.

Many businesses use Net Present Value (NPV), Internal Rate of Return (IRR) or other Return on Investment (ROI) metrics to evaluate business cases.  While the focus is often on measuring the impact of changes in costs, these metrics are actually intended to measure changes in cash flows.  Consequently, excluding the favorable cash flow generated by a reduction in inventory would significantly understate the value of such a change.  The cost of money is reflected in the discount rate used to calculate NPV.  So, to include cost of money as a cost reduction is inappropriate as it effectively double counts those benefits.

A reduction in inventory generates a one-time favorable cash flow, as long as the inventory is sold or otherwise consumed and not scrapped.  The same reduction also creates an on-going reduction in the costs associated with holding inventory, such as the risk of loss or obsolescence and the costs of storage. Assessing those costs can be a little tricky, and I will discuss that in more detail below.  However, the bottom line is that a business case for inventory reduction is fundamentally about the cash flow impacts, and can’t be viewed solely through a cost reduction lens.

Inventory is primarily a cash flow benefit

Inventory reduction creates a one time cash benefit

Common Mistake #2: Treating inventory reduction as a recurring benefit

When considering cost reductions, if a cost is reduced and stays reduced, it delivers benefit not only in the year of reduction but in each year after that.  So if inventory is reduced and remains reduced, wouldn’t the inventory reduction continue to deliver benefits in subsequent years?  The answer is yes, and no.  When inventory is reduced, the cash flow benefit occurs only once – at the same time as the inventory reduction.  However, the cost savings associated with maintaining that inventory do recur.  For example, let’s say I have a plan to eliminate 100 pallets of inventory with a value of $ 1 million.  This inventory is stored in a public warehouse that charges $12 per pallet per month.  When the inventory is eliminated, there is a one-time favorable cash flow of $1 million.  This cash flow occurs at the time of inventory reduction.  If the inventory is reduced say, $ 700,000 in Year 1 and $ 300,000 in Year 2 then there would be corresponding cash flows of $ 700,000 in Year 1 and $300,000 in Year 2.  And nothing afterward.  Note that the second year only shows the incremental benefit that occurs in that year and not the cumulative amount.  It would be incorrect to show the total benefit of $ 1 million in any later years because this benefit only occurs once.

Now, with an average value of $ 1 million / 100 pallets = $ 10,000 per pallet these numbers would correspond to a reduction of 70 pallets in Year 1 and 30 pallets in Year 2.  With a storage cost of $12 per pallet per month this would generate a savings of $ 10,080 in the first year (assuming the inventory was all reduced in January) and an incremental $ 4,320 per year in Year 2.  These cost savings are both cumulative and recurring.  So while the first year savings is only $ 10,080, the savings in Year 2 and beyond are $ 14,400 (10,080 + 4,320).  Storage isn’t the only cost that might be reduced, but it will suffice for this example.  Other elements of holding cost should be treated the same way

Common Mistake #3: Failing to properly consider holding costs

In the example above, I used storage cost to illustrate a recurring cost that might be reduced as a direct consequence of a reduction in inventory.  Clearly, a reduction in inventory can reduce costs elsewhere and these cost impacts [1]should be considered as part of the overall business case for inventory reduction.  Very often I see these impacts either left out or not treated properly.  A business case should address all of the costs that will change as a result of the decision being evaluated – and nothing else.  With the exception of those cases contemplating strategic or structural changes, a business case should be developed on a marginal basis with the status quo as a starting point.  The challenge then is to identify those margin changes.

We have already discussed the cost of capital.  While less inventory reduces the cost of money, it is not appropriate to include this as a cost savings.  Rather, the cost of money is addressed through the discount rate in the NPV calculation.  That leaves us with a number of other areas to consider:

  • Storage/warehousing costs
  • Obsolescence
  • Shrinkage
  • Taxes and Insurance
  • Inventory management costs

Storage is perhaps the most tricky of these.  In the example above, inventory was in a public warehouse that charged a flat monthly fee for each pallet in storage.  In cases like this, any reduction in the number pallets would deliver a reduction in cost.  However, most companies find themselves in a more complex situation with a mix of owned and contract warehousing.  Depending on the business case, it also may be necessary to consider inventory that is “stored” in-transit in trucks or ocean containers or that is on the factory floor.  This is where the concept of marginal analysis is critical.  If you have an owned warehouse that is 95% full, then reducing inventory so that it is only 80% full will not reduce the cost of operating the warehouse.  This is because the cost of the warehouse is largely fixed, and driven by the level of activity – not by the level of inventory[2].  If on the other hand, the owned warehouse is full to the point where off-site overflow storage is being utilized then there may be a clear savings if the off-site location can be downsized or eliminated.  There may also be an opportunity to eliminate the cost of transporting inventory to the secondary warehouse and bringing it back.  With respect to storage costs, it is important to ask exactly what costs will be reduced or eliminated based on the change being proposed.  If you are reducing inventory in-transit or work-in-process it may very well be that the answer is that there is no impact to storage costs.  What is required here is a thoughtful process to understand exactly what, if any, costs will be altered by the decision.

Storage costs may be the trickiest, and in my experience the most frequent source of error, but a similar process is needed for other components of holding costs as well.  Understand the impact of the inventory reduction, think through the impacts on the drivers of other costs, and include the appropriate amount.  In the case of both shrinkage and obsolescence[3] costs, it’s important to consider where the inventory is in the supply chain.  How do loss, damage, or yield rates vary along the supply chain?  Exactly what inventory is being reduced, and what rate applies to that inventory?  Similarly with obsolescence, raw materials and components in the upstream portion of the supply chain tend to have much lower obsolescence rates than downstream inventory sitting in distribution centers.  Taxes and insurance should be treated similarly.

As a general rule, the cost of managing inventory (people and systems) does not change due to the level of inventory.  Rather it is driven by the number of stock keeping units (SKU’s) that need to be managed.  However, if the source of the inventory reduction is a product portfolio rationalization, then it may be appropriate to include a component of these costs.

[1] See How is Holding Cost Calculated for more detail

[2] I will be quick to acknowledge that a very full warehouse leads to inefficiencies and there may be labor savings from creating a certain amount of free space in a full warehouse.  These should absolutely be considered if they exist.

[3] For purposes of this discussion, think of obsolescence as anything that renders the product unsaleable. This would include perishability as well as the traditional notion of the product becoming obsolete for lack of demand.

Inventory reduction can also reduce on-going costs relating to holding and managing inventory

A Simple Example

A Simple Example

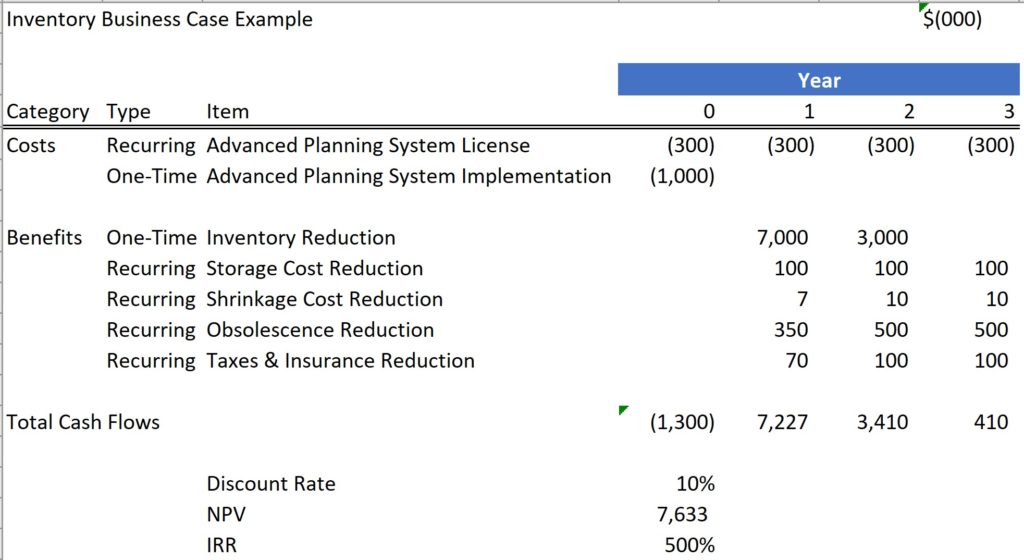
Perhaps the best way to illustrate the right way to do an inventory business case is with a simple example.  It has been proposed to implement additional functionality in the planning system to better manage inventory.  This requires new software which will have an annual license fee of $300,000 and an initial implementation cost of $ 1 million.  It is expected that the new software will deliver a $ 10 million reduction in inventory over two years, with $ 7 million in the first year after implementation and an additional $ 3 million in the second year.  The initial $ 7m reduction will allow the company to exit an overflow warehouse with cost savings of $ 100,000 annually.  Inventory in this location typically incurs shrinkage of 0.1% annually and obsolescence / perishability of 5% annually.  Taxes and insurance are 1% annually. 

With this information, a correct business case would look like this:

Note that each element has been labeled as to whether it is on-time or recurring.  As noted above, the full savings in storage costs occurs with the first $ 7m inventory reduction.  The other holding cost elements ramp up in line with the cumulative savings in inventory ($7m reduction in Year 1, $ 10m reduction in Year 2).

All in, this is a very attractive business case with a 500% internal rate of return (IRR), and a net present value of over $ 7m.

The spreadsheet shown above can be found here: Inventory Business Case Example

Holding Cost =
+ Cost of Money
+ Property Taxes
+ Insurance
+ Obsolescence
+ Shrinkage
+ Physical Storage

It’s universally agreed that there is cost to holding inventory, but very few companies have a good understanding of what that cost really is.  Optimizing inventory implies a trade off between the cost of carrying inventory with some benefit, such as being able to meet customer expectations, or a reduction in operating costs.  However, it’s often easier to articulate the benefits vs. the cost of the inventory, leading companies to carry more than they should.  Similarly, I have seen many business cases for inventory reduction that were fundamentally flawed in the way they addressed inventory related costs.

The goal of this article then is to demystify the concept of holding costs and get you asking the right questions to be able to use this concept in business decisions

Holding costs are usually expressed as a percentage of the inventory value.  This can be helpful as most inventory decisions are on a margin basis, i.e., adding or reducing a certain amount of inventory.  I’m not sure where this practice originated, but it may come from the simple fact that many components of the holding cost are also typically expressed as percentages.

Holding cost should include all of the costs related to financing, storing, and disposing of inventory.  Typically it consists of the following components:

  • The cost of the money that is tied up in inventory
  • Where applicable, the cost of property taxes paid on inventory
  • The cost of insuring inventory or accepting the risk of loss
  • The cost of obsolescence, including both the cost of the inventory itself and the cost of disposal
  • The cost of physically storing the inventory

Each of these is discussed in turn below.  I leave the physical storage costs for last because these are the most problematic.

Cost of Money

The cost of money addresses the cash that is tied up in inventories. Inventory is a key component of working capital and consumes cash that could be used elsewhere: to pay down debt, to invest in a new business , to finance new capital equipment, to dividend to shareholders, etc.  As such, the cost of money should be viewed as an opportunity cost.  What else could I do with this cash if it wasn’t tied up in inventory?

Some companies use the company’s marginal, short term borrowing rate as the cost of money.  Today (in late 2020), that number is likely to be only a few percentage points.  I personally believe that this approach significantly understates the cost as it implies that the company has nothing better to do with extra cash than pay down short term debt.

Cost of Money

A better approach is to use what is know as the Weighted Average Cost of Capital, or WACC.  The WACC represents the average return expected across all of a company’s sources of cash, weighted by the amount of cash from each source.  It incorporates not only the cost of short and long term borrowing, but also the return expected by shareholders.  In my experience, even with low borrowing costs it is common for WACC to be in the 9-12% range depending largely on a company’s size and ownership structure. 

Many companies publish their WACC for use in internal business cases, either as the discount rate for Net Present Value (NPV) calculations or as the expected minimum return or ‘hurdle rate’ for investments.  If your company does not publish a rate you can usually get it from Finance and particularly the Treasury department.

WACC (Weighted Average Cost of Capital)
Property Taxes
Property Taxes

The second element of holding cost is property tax. Some tax jurisdiction will assess property tax on the value of inventory.  Of course if you operate in multiple locations you may pay property tax in some and not others, and when you do pay the rates will almost certainly be different.  For simplicity, I recommend computing an average rate and using that.  Your company Tax team within the Finance organization can help you understand total annual inventory related taxes and you can divide this by the average inventory balance to get a percentage.

Insurance

Insurance is the next component.   Most companies will carry insurance against the risk of catastrophic loss.  The trick here is to identify all of the relevant insurance costs (don’t forget insurance for goods in transit) and separate out the portion that relates to the inventory from that which relates to liability or replacement cost of buildings.  Treasury is usually responsible for managing the insurance policies or you may want to contact your corporate Risk group.

Taxes and insurance can be a bit of work and it’s common to add 1% to cover both of these.  Not that that number has an particular scientific basis or validity.  If you want to be precise, the actual numbers should be easily available.

Insurance
Obsolescence
Obsolescence

Inevitably, at some point you will make or buy too much of something and it will sit in inventory (and sit, and sit).  When it’s clear that there is no more demand for a product or material, accounting principles require that a reserve account be setup to reduce the value of the inventory to zero.  What’s important in determining obsolescence cost is not the value in the reserve account, but the annual amount that is added to the account.  For example, a company may have $ 100 million in inventory and an inventory reserve of $15 million.  Each year the company charges (as an expense) $5 million to the reserve account and removes a similar amount as inventory is scrapped.  The number we want is the average amount added to the reserve annually.  Take this as a percentage of total inventory (in this example, $5m / $100m = 5%) as the holding cost due to obsolescence

Shrinkage

Another basic fact of inventory is that things disappear.  They get lost, or damaged, or worse pilfered.  Regardless of the reason, the result is the same: the lost inventory must be written off as an expense and removed from inventory.  To compute the shrinkage component of holding cost, take the annual cost of shrinkage and divide by the average inventory balance to get a percentage.

Shrinkage
Physical Storage
Physical Storage

At last we come to the physical storage costs, and this is where things get interesting.  Physical storage, and how you should think about it, is highly situational. Particularly if you are working on a business case for inventory reduction.  Let’s look at some possible situations as examples:

  1. Your inventory is held in a shared warehouse where you pay a fixed fee per pallet per month for storage
  2. Your inventory is held in a warehouse that you own or lease with 80% of the available pallet positions occupied
  3. Your inventory is held primarily in a a warehouse that you own or lease, but the warehouse is completely full and 1,000 pallets are stored at a second warehouse where you lease space

These situations are not mutually exclusive.  Indeed I once worked at a company where all three situations existed at the same time but for different warehouses.

Situation #1 is the simplest in the context of holding cost as there is a very clear cost that is tied directly to the amount of inventory on hand.  In this case, simply take the annual cost per pallet and divide by the average value of a pallet to get a percentage.

Situation #2 is a bit more tricky.  For longer term, strategic decisions about inventory it would be appropriate to take the annual facility costs (not including labor) and divide by the average inventory value to get the holding cost percentage.  But here’s the catch: if you reduce inventory you won’t save any of this cost.  The warehouse is still there, it’s just less full.  The reduction in inventory hasn’t saved you a penny on the physical storage costs.  This is no good if you are trying to make a business case on inventory reduction!  From a business case perspective, you may still be able to make a case on cost avoidance.  For example, the inventory reduction prevents you from having to go out and lease more space next year as volumes increase (if that is actually true).  If there is another use for the space or the potential to lease less space going forward, then you can also apply an opportunity cost.  But if it’s just a simple case of inventory reduction your business case may be out of luck here.

Situation #3 is better, because the cost reduction opportunity is clear.  If you can reduce inventory by 1,000 pallets, you can eliminate the cost associated with the second warehouse.  And if this is strictly an overflow warehouse, you can eliminate the labor at that site and the cost of trucking material back and forth at the same time.  As with Situation #2, if you are looking to calculate a holding cost for strategic decisions (or, say to use in inventory optimization decisions) you can roll up all the facility costs and divide by the average inventory value to get a percentage cost for physical storage.  If you’re trying to make a business case for inventory reduction, you can build that case on the elimination (or downsizing) of the secondary warehouse as these are very real costs that can be eliminated if inventories can be reduced to the point that they fit in the primary warehouse.

As a final thought in this section, there is no physical storage cost for inventory in-transit.  Business cases that deal with reducing inventory by reducing transit time would not have a physical storage component to holding cost for in-transit inventory — though it would still be appropriate to apply physical storage costs to any resulting reduction in warehouse inventory due to the reduced lead times.

Operational Inventory ≠ Financial Inventory

When measuring inventory levels it’s important to make a distinction between two different views: Financial, or what appears on financial statements, and Operational, what your planning team uses to make decisions.  Managers should understand the differences and be able to translate their operational decisions and actions to the balance sheet.

Operational inventory is simply what is visible in your company’s planning system (sometimes this is called Gross Inventory).  Generally speaking, this will be the quantity physically on hand.  There are of course exceptions to this as detailed below.  Operational inventory is valued at cost and so the total value of operational inventory is simply (quantity on hand) x cost.  Operational Inventory is important because it is what is used as the input to planning production and purchases.

Operational Inventory Value = Sum(Quantity on Hand x Cost)

What cost to use?  Every company has an established way of costing material in inventory, although one company may use different methods for different types of materials.  There are basically two approaches in common use: standard costing and average costing.  Standard costs are typically determined once a year determined during the annual budget process.  The standard cost represents what the company expects to pay for each unit of inventory.  ‘Expects’ being the operative word.  This can be very simple (e.g., the supplier contract price for the next year) or the result of complex calculations (e.g., for a manufactured item).  The important thing is that it’s a fixed number that typically only changes once per year.

Average costing seeks to compute the average cost for the items in inventory and is frequently used for spare parts and materials that are not end products or components of end products (otherwise known as indirect materials).  The average most often assumes FIFO, or First In, First Out, inventory movement, though other assumptions are possible (LIFO or Last In First Out, etc.).  Under this approach, if you have 97 units in inventory and a FIFO assumption of how inventory moves, the cost would be the average cost of the last 97 units to arrive.

Once you understand how your company handles costs, you should also get clarity of exactly what is included in Quantity ‘On Hand’.  If you work in a small company with only one location, it’s pretty safe to assume that ‘On Hand’ only includes the inventory that is physically present.  Larger companies, particularly those with more sophisticated ERP systems such as SAP, may also track inventory that is:

  • In transit between company locations
  • In the hands of suppliers (e.g., when a production step is outsourced)
  • Inbound from suppliers (less common as it requires data integration with the supplier)

To make thing even more complicated, what is considered On Hand may vary by location, particularly if different systems are used.  Be sure to understand what the rules are for each location in your company.

Financial Inventory =
+ Operational Inventory
+ Internal In-Transit
+ In the Hands of Suppliers
+ In-Transit from Suppliers
+ In-Transit to Customers
± Cost Variances
– Reserves
– Intercompany Profit

Believe it or not, valuing Operational Inventory is the easy part.  Financial Inventory starts with Operational Inventory and applies a number of adjusting entries to get to the amount that the company shows on its balance sheet.  Let’s look at each of these adjustments:

Internal In-Transit

If quantities in-transit between company locations (e.g., from a manufacturing site to a distribution center) are not visible in the company systems, then an accounting adjustment is needed to capture the value of this inventory.  There are multiple ways to do this, such as looking at quantities shipped and not yet received at month end.

In the Hands of Suppliers

Some companies will send inventory to suppliers to perform a process step or other activity.  Some examples are sending material to a supplier for sterilization (medical devices) or sending inventory to a co-packer to build store displays (consumer goods).  Regardless of the reason, if this inventory is not visible in the company systems then it needs to be added back via an accounting entry.  Typically this will cover the time from shipment to the supplier to receipt of the resulting item

In-Transit from Suppliers

It’s common for a company to take ownership of inventory before it is physically received.  If inventory is purchased from suppliers at any INCOTERM that does not include delivery (i.e., other than DAP or DDP), and transportation is anything less than instantaneous, it will be necessary to add an amount for in-transit inventory.  For example, let’s say your company purchases material from a supplier in China and the goods are shipped by sea to your location in California.  If the terms of the purchase are Ex-Works, then you take ownership as soon as the goods leave the suppliers location.  However, they may not be received and visible in your inventory for a month or more.  One way to value this is to look at inbound shipments for which you have received an invoice from the supplier or other indication of shipment such as an ASN (Advanced Ship Notice) and subtract what has been physically received.  There are other approaches and you should ask your Finance team how it’s done at your company.

In-Transit to Customers

Similarly, if you ship to customers using an INCOTERM that causes title to transfer somewhere after the goods leave your location (e.g., a delivered term) then it’s necessary to account for the inventory that is no longer on your system (having been shipped), but which you still technically own.

Cost Variances

Good news! If your company uses average costing, you can skip this section.  For companies that use standard costing however, it’s necessary to adjust the value of inventory by any variances from the standard.  This is perhaps best explained through an example.  Last year you set the standard cost for an item at $1.00.  However, your purchasing team was later able to negotiate a discounted price of $0.98.  You have 100 units in inventory currently.  If you value that inventory at the standard cost it is worth $100.  But you only paid $98 to obtain it.  To correct for this, an accounting entry is added to reduce the value of the inventory by the amount of this favorable variance.  So the value of the inventory is then 100 units x $1.00 standard cost – (100 units x $0.02 favorable variance) = $98. Most companies will capitalize both purchasing cost variances and production cost variances into a special inventory account to address this.  These variances may or may not be tied to the specific items that generated them.  Even if they are, the variance account may not be reduced at the same time that the inventory is consumed or shipped as many companies will transfer these variances into cost of goods sold (COGS) on a fixed schedule (e.g., variances go to the balance sheet for three months and are then amortized or transferred to costs).  Note that variances can be negative (favorable) as in the example above or positive (unfavorable) resulting in an increase in inventory.

Reserves

Accounting rules require a company to value inventory at the “lesser of cost or market”.  Consequently, if the Operational Inventory value exceeds what the inventory could reasonably be sold for, a reserve must be taken.  From an accounting perspective, the difference between book (Operational) value and fair market prices is written off as a cost and the value kept in a reserve account that acts as an offset, or negative, to inventory value.  Reserves may be taken for a variety of reasons:

  • Product cost exceeds selling price (i.e., a money losing product)
  • Obsolescence.  There is no longer a market or need for the item
  • Quality.  Items that failed quality inspection and are expected to be scrapped or that are otherwise unfit for use

The methodology for computing reserves can vary from simple to complex.  Best practice is to involve Planning in the identification and calculation of reserves, particularly for obsolescence.

Reserves may or may not be tied to the specific item(s) that caused them to be created.  Reserves are reduced by the value of inventory scrapped.

Intercompany Profit

If you work for a company that has more than one legal entity, then it’s necessary to adjust inventory to remove any internal profits.  Again, this is probably best explained via an example.  Your manufacturing site in the US produces a product at a cost of $100 per unit.  The US company then sells the product to your German subsidiary for $110.  The German company incurs $5 in freight cost and so the inventory in Germany reflects a cost of $115 per unit.  However, the actual cost to the company of the German inventory is only $105 (the original $100 manufacturing cost plus $5 in freight).  If we are going to aggregate total company inventory, we need to adjust the value of the German inventory to remove the $10 ($110 selling price – $100 cost) internal profit created by the sale between the two legal entities.  Companies that have this situation will typically capture the intercompany profit in an account that is an offset (negative) to inventory until the goods are sold to a customer outside the company.